What Is Graphical Dashboard Widgets for WordPress?
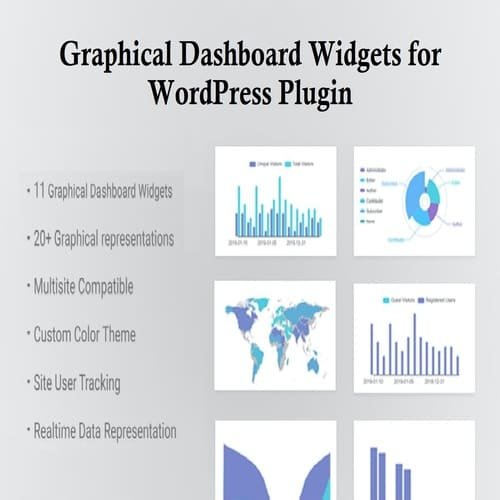
Graphical Dashboard Widgets for WordPress is a powerful plugin that transforms your plain admin dashboard into a visually rich data hub. With intuitive, real-time charts and graphs, it helps administrators and site owners monitor key performance metrics without needing external tools.
Whether you’re tracking visitor behavior, post engagement, WooCommerce sales, or content performance, this plugin gives you a centralized, data-driven overview right inside your WordPress backend.
Why Choose This Plugin?
✔ Real-Time Graphs & Charts – Instantly visualize traffic, content stats, user activity, and more
✔ Customizable Widgets – Choose what metrics you want to see and how to display them
✔ Supports WooCommerce & Custom Post Types – Track sales, revenue, orders, and products
✔ Lightweight & Fast – Optimized to load quickly without bloating your dashboard
✔ GPL Licensed – Install and use on unlimited websites without activation keys
Ideal For:
Bloggers and content creators
WooCommerce store owners
Agencies managing multiple sites
Admins and site managers who need quick insights
Developers looking for client-ready dashboard visualizations
Key Features:
Multiple chart types: bar, line, pie, and donut graphs
Data visualization for users, posts, comments, WooCommerce orders, and more
Drag-and-drop widget layout
Custom timeframes and data filters
Clean and modern UI matching WordPress style
Compatible with multisite environments
Optional Google Analytics integration
How It Works:
✅ Install and activate the plugin
✅ Choose and configure the widgets you want to display
✅ Customize chart types and data ranges
✅ View your WordPress performance at a glance from the dashboard
Graphical Dashboard Widgets for WordPress is the perfect solution for turning your admin area into a powerful analytics hub—no coding or third-party tools required. And since it’s GPL licensed, you can use it on unlimited websites with no restrictions.


Reviews
There are no reviews yet.